IMD 食品栄養データ分類評価サービスIMD Food & Nutrition Data Classification & Evaluation Service
各種指標や定義に基づき食品を分類・評価し統計算出をサポートします。We classify and evaluate foods based on diverse metrics and definitions, supporting statistical analysis and reporting.
Nutri-score の日本の食品分布例Example: Nutri-Score Distribution of Foods in Japan
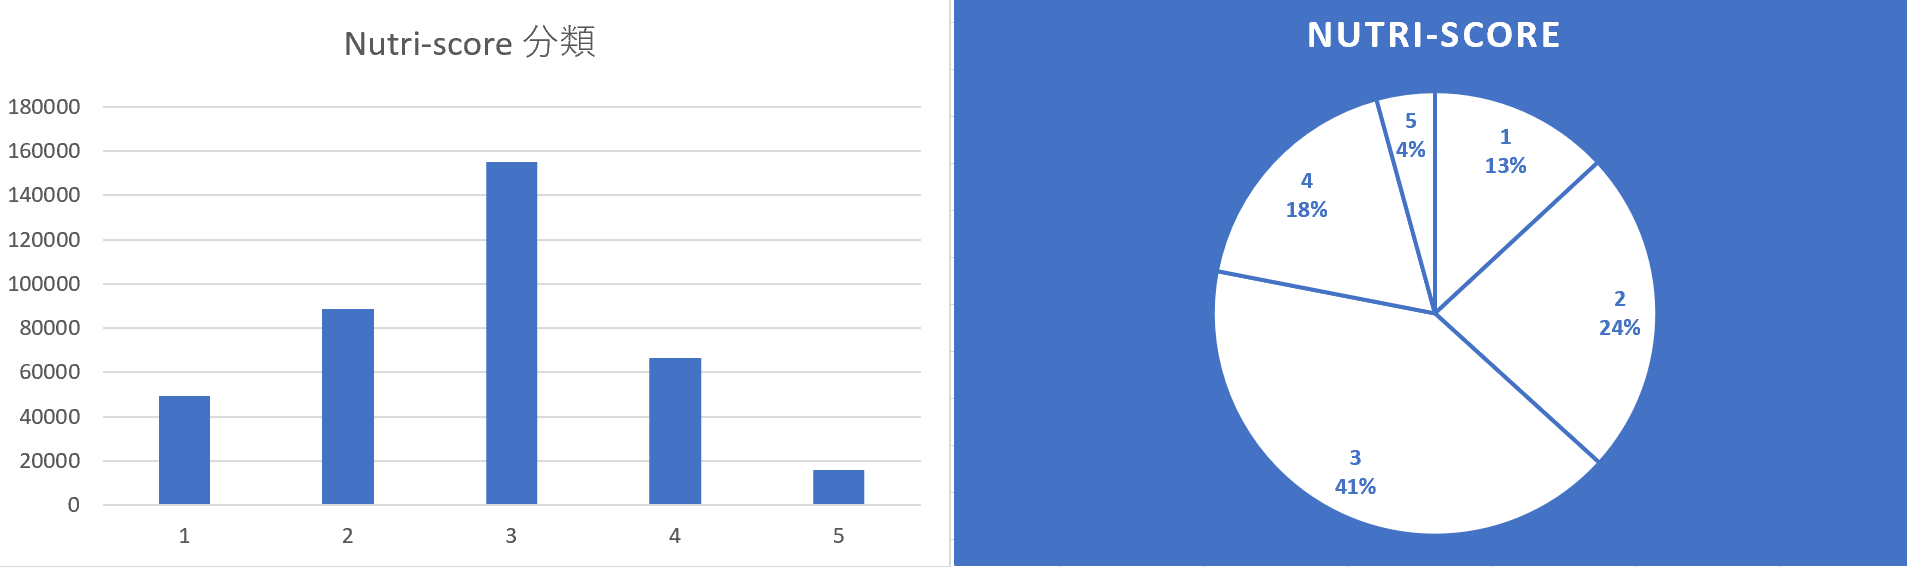
約 38 万件の評価データをベースとして、Nutri-score で分類された食品の分布グラフです。Nutri-score では、食材を基準に分類されているため、その食品としての評価を実施するために弊社データを活用して評価致しました。(加減算ポイント方式で算出され、その各範囲毎に分類されるスコアに落とし込んでいます) This distribution chart is based on approximately 380,000 evaluated items and shows foods classified by Nutri-Score. Because Nutri-Score is defined and categorized based on ingredients, we leveraged our database to evaluate items at the food level. (Scores are computed using an additive/subtractive point system and mapped into category ranges.)
ある評価分類での食品分布例Example: Food Distribution Under a Given Classification
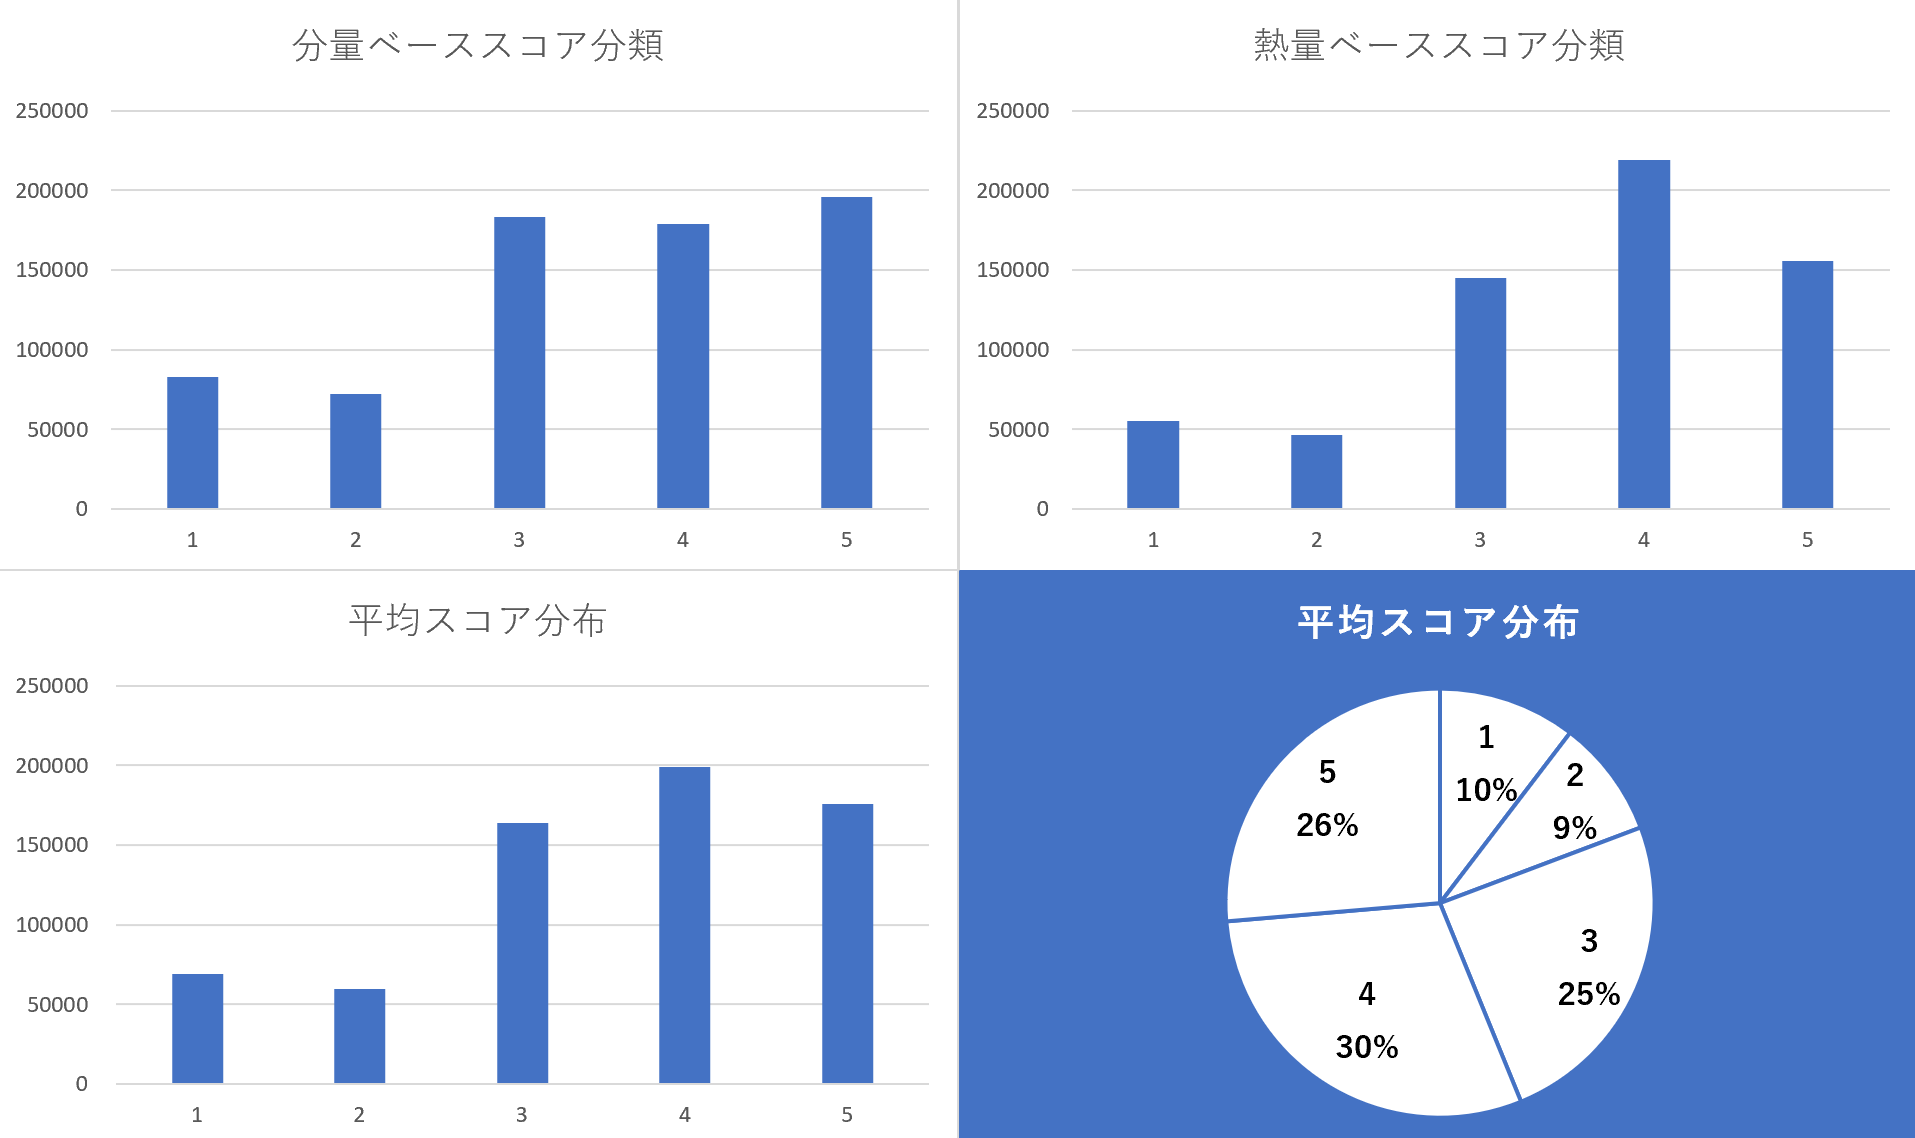
こちらは「ある基準」で分類された食品の分布グラフです。Nutri-score と似ていますが、食材を基準に若干曖昧に分類されているだけなので、そのままでは「食品」に適用できません。そのため、食品を構成する食材の「割合」をエネルギーベース(熱量、カロリー)で判断するか、分量(重量、重さ)で判断するかでの、異なる2種類の評価手法で算出したものと、その平均値をとったグラフです。 This chart shows the distribution of foods classified by a certain criterion. While it resembles Nutri-Score, it is defined somewhat ambiguously based on ingredients, so it cannot be directly applied to “foods” as-is. We therefore compute two variants depending on whether the ingredient “ratio” in a food is determined by energy (kcal) or by amount (weight), and we also visualize their average.
Nutri-score や「ある基準」両者ともに、値が小さい方が「健康的」とされ、大きい方が逆を示していますが、全く同じ日本の食品データを参照したにも関わらず、評価定義が異なる場合、ここまで明らかに分布が異なっていることが明確に可視化されています。 For both Nutri-Score and this “criterion,” smaller values are considered “healthier” and larger values indicate the opposite. Even when referencing the same Japanese food dataset, different evaluation definitions can produce clearly different distributions—this visualization makes that difference explicit.
日本ではこの他にも主に糖尿病関連の 6 分類、SV値、DVSなども乱立していますが、全ての評価基準について、弊社の全品について(=コンビニや外食、商品、郷土料理まで)弊社では厳密な定義をご相談の上で算出・可視化することが可能ですので、ご相談下さい。(一定のジャンル・カテゴリのみなどに絞って評価することも可能です) In Japan, many other standards also exist (e.g., diabetes-related six-class categories, SV value, DVS, etc.). For any evaluation standard, we can compute and visualize results across our full dataset (including convenience-store foods, restaurant meals, packaged products, and regional cuisine) after aligning on a precise definition. We can also scope the evaluation to specific genres/categories if needed.
(参考)辛さ食材の含有スコアReference: Spicy-Ingredient Content Score
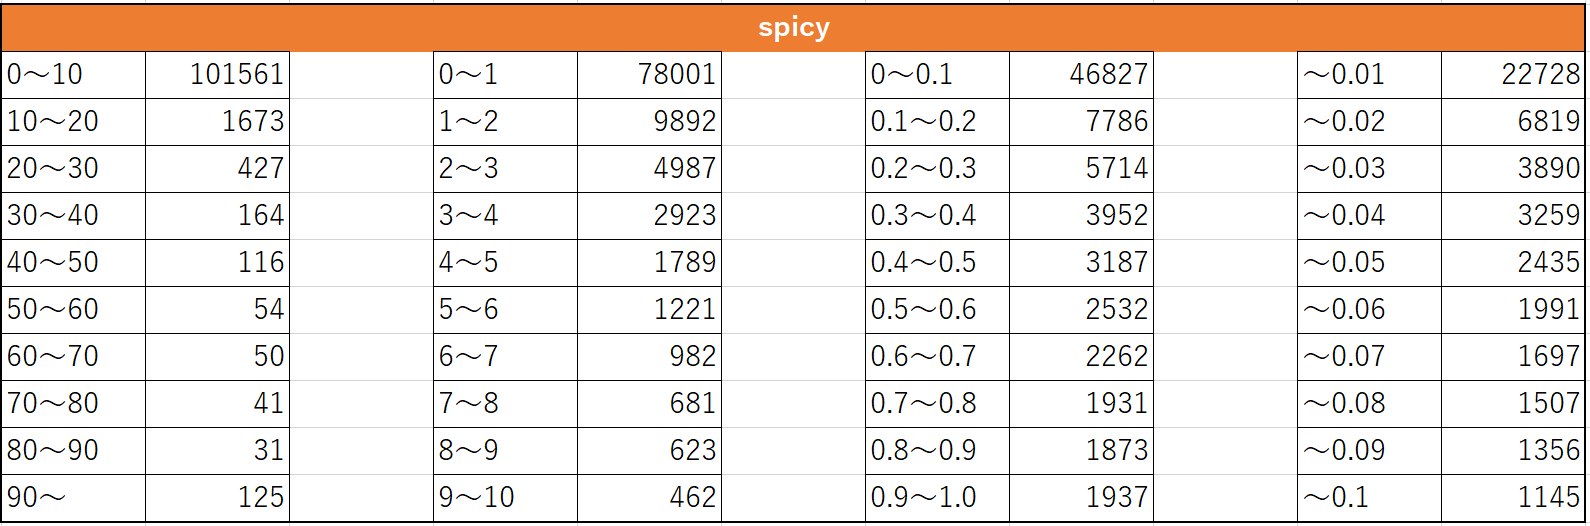
グラフ化に直接な意味がないものでも、この値をもとに検索APIで範囲指定や分野を絞り、具体的な食品を確認することができます。 Even when a graph itself is not the primary goal, you can use this value with our Search API to filter by range or domain and inspect specific foods.
弊社ではこのような新規・挑戦的なスコアリングについても積極的に実装し、評価テスト用プラットフォームにて体感・利用いただいております。 We actively implement new and exploratory scoring approaches like this and provide them via our evaluation/testing platform for hands-on use.
お問い合わせContact
食品の分類評価や統計算出に関するご相談は、お気軽にお問い合わせください。Feel free to contact us about food classification, evaluation, and statistical analysis.
Webでお問い合わせContact via Web電話: 050-5848-1465 (平日13時~17時)Phone: 050-5848-1465 (Weekdays 13:00–17:00 JST)